Image Details
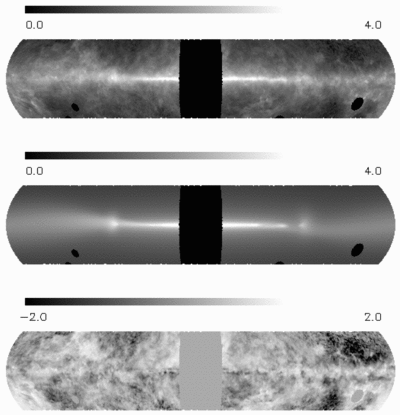
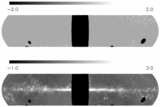
Caption: Fig. 4.
240 μm sky maps of the smoothed DIRBE data (top), the modeled emission (middle), and the relative difference between the modeled and observed emission (bottom). The top two maps are on a logarithmic scale, while the bottom map is on a linear scale.
Copyright and Terms & Conditions
© 2001. The American Astronomical Society. All rights reserved. Printed in U.S.A.


