Image Details

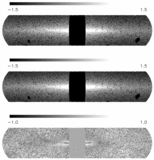
Caption: Fig. 2.
Map of the ratio of the smoothed to unsmoothed data (top), and the estimated local error σ240 (bottom). The maps are Mollweide galactic projections for ﹩\vert b\vert < 30^{\circ }﹩, on logarithmic scales, indicated by the gray‐scale bars. Blanked pixels are regions excluded from the present analysis (see text). Positive Galactic longitudes are to the left of center.
Copyright and Terms & Conditions
© 2001. The American Astronomical Society. All rights reserved. Printed in U.S.A.


