Image Details
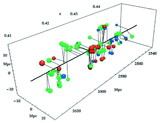
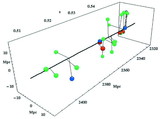
Caption: Fig. 8.
Eight group‐galaxy cross‐correlation functions for the eight redshift features in Table 2, and averaged cross‐correlation functions for the shifted control features (triangles). The error bars represent the control feature‐to‐feature scatter. Details in the text.
Other Images in This Article
Copyright and Terms & Conditions
© 2000. The American Astronomical Society. All rights reserved. Printed in U.S.A.
Copyright ©
2025 Astronomy Image Explorer. All Rights Reserved.