Image Details
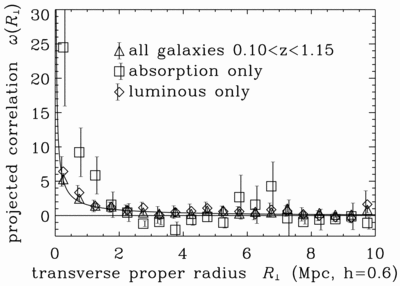
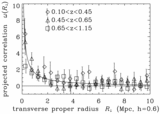
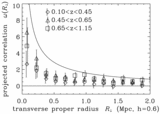
Caption: Fig. 6.
Projected correlation function in proper coordinates for the whole J0053+1234 sample, just those J0053+1234 galaxies with absorption‐line–dominated spectra, and just those J0053+1234 galaxies with intrinsic luminosities (as estimated according to the text) ﹩\mathrm{log}\,L/ L^{*}> -0.6﹩. The solid curve shows a correlation function of the form of eq. (4) with ﹩r_{0}=3.5\,\mathrm{Mpc}\,﹩ and ﹩\gamma =1.8﹩, projected through ﹩\Delta v_{r}=1000\,\mathrm{km}\,\,\mathrm{s}\,^{-1}﹩ at ﹩z=0.55﹩ according to eq. (2).
Other Images in This Article
Copyright and Terms & Conditions
© 2000. The American Astronomical Society. All rights reserved. Printed in U.S.A.
Copyright ©
2025 Astronomy Image Explorer. All Rights Reserved.