Image Details
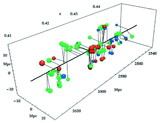
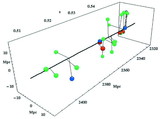
Caption: Fig. 5.
Projected correlation function in proper coordinates in the HDF region in three redshift bins. The correlation function is estimated as described in the text. The solid curve shows the same correlation function as that shown in Fig. 4. Note that the horizontal axis scale is different from that in Fig. 4, because the angular separation coverage is smaller in the HDF sample than in the 0053+1234 sample.
Other Images in This Article
Copyright and Terms & Conditions
© 2000. The American Astronomical Society. All rights reserved. Printed in U.S.A.
Copyright ©
2025 Astronomy Image Explorer. All Rights Reserved.