Image Details
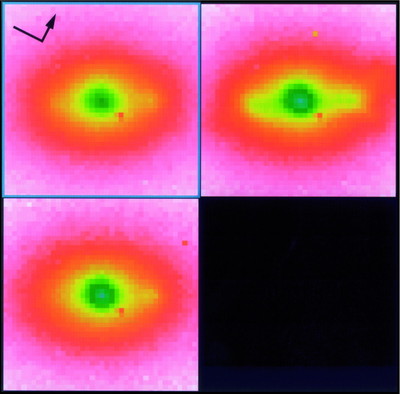
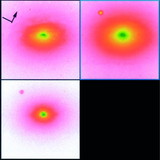
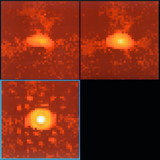
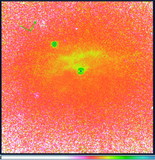
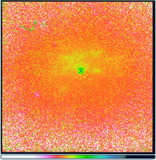
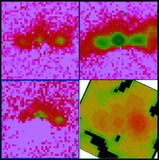
Caption: Fig. 4.
(a) Inner 8﹩\farcs﹩4 × 8﹩\farcs﹩4 regions of the NICMOS camera 3 images of IC 5063 in F166N (upper left), F190N (upper right), and F215N (lower left). The image y‐axis is 27﹩\fdg﹩00 east of north, as shown in the upper left panel (the arrow denotes north). (b) Inner 8﹩\farcs﹩4 × 8﹩\farcs﹩4 regions of the images of IC 5063 in continuum‐subtracted F166N (upper left), continuum‐subtracted F190N (upper right), and continuum‐subtracted F215N (lower left). The image y‐axis is 27﹩\fdg﹩00 east of north, as shown in the upper left panel of (a) (the arrow denotes north). The color scale is logarithmic, with green or blue denoting the brightest level and pale pink denoting the faintest level. Lower right panel: inner 8﹩\farcs﹩4 × 8﹩\farcs﹩4 region of the ATCA 8 GHz radio continuum image from Morganti et al. (1997). The orientation is identical to that of the other panels. The color scale is logarithmic, with red denoting the brightest level and black denoting the faintest level. Most of the flux (195 mJy) comes from the NW knot. The beam shape is 1﹩\farcs﹩1 × 0﹩\farcs﹩8 elongated in P.A. = 51﹩\fdg﹩8. The resolution is 0﹩\farcs﹩3 pixel−1. Note the clear similarity with the emission‐line images in the other panels.
Other Images in This Article
Copyright and Terms & Conditions
© 1998. The American Astronomical Society. All rights reserved. Printed in U.S.A.