Image Details
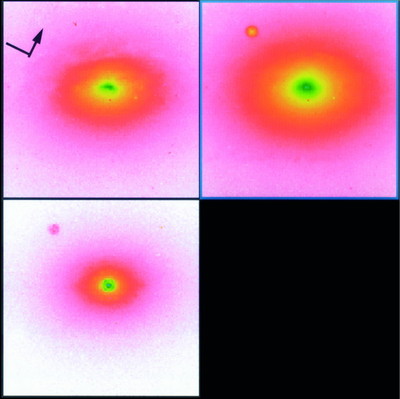
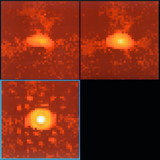
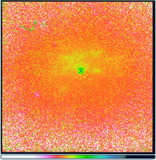
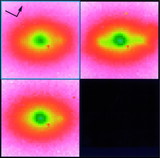
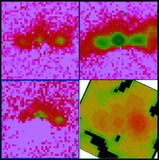
Caption: Fig. 1.
(a) Central 12﹩\farcs﹩1 × 12﹩\farcs﹩1 regions of the NICMOS camera 2 images of IC 5063 in F110W (upper left), F160W (upper right), and F222M (lower left). The image y‐axis is 26﹩\fdg﹩58 east of north, as shown in the upper left panel (the arrow denotes north). The color scale is logarithmic. In the upper panels, green denotes the brightest regions, and pale pink or white denotes the faintest regions. In the lower left panel, blue denotes the brightest regions, and white denotes the faintest regions. The circular feature in the upper left‐hand corner of the upper right and lower left panels is caused by the coronagraphic hole (this feature is not visible in the upper left panel because the flat used for F110W incorporated the coronagraphic hole). (b) Central 3﹩\arcsec﹩ × 3﹩\arcsec﹩ regions of the images after subtraction of the galaxy, showing the nuclear source in F110W (upper left), F160W (upper right), and F222M (lower left). The image y‐axis is 26﹩\fdg﹩58 east of north, as shown in the upper left panel of (a). The color scale is logarithmic. White or bright yellow denotes the brightest regions, and dark brown denotes the faintest regions.
Other Images in This Article
Copyright and Terms & Conditions
© 1998. The American Astronomical Society. All rights reserved. Printed in U.S.A.