Image Details
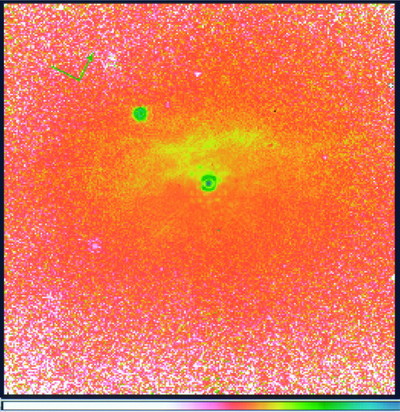
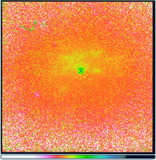
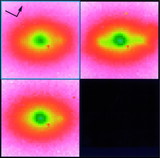
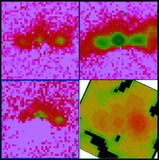
Caption: Fig. 3.
(a) Color map (entire 19﹩\farcs﹩4 × 19﹩\farcs﹩4) of IC 5063 in F110W–F222M. As in Fig. 1a, the coronagraphic hole is visible in the upper left quadrant. (b) Color map (entire 19﹩\farcs﹩4 × 19﹩\farcs﹩4) of IC 5063 in F160W–F222M. The image y‐axis is 26﹩\fdg﹩58 east of north in each case, as shown (the arrow denotes north). The color scale in each case is linear and is shown at the bottom.
Other Images in This Article
Copyright and Terms & Conditions
© 1998. The American Astronomical Society. All rights reserved. Printed in U.S.A.
Copyright ©
2025 Astronomy Image Explorer. All Rights Reserved.