Image Details
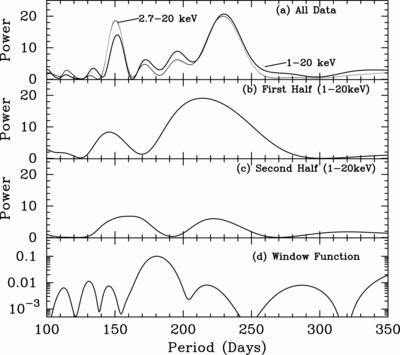
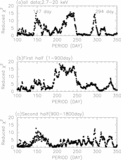
Caption: Fig. 8.
Power spectra of the Cyg X‐1 light curve in the period range from 100 to 350 days. (a) Two power spectra calculated using all data in the two energy bands, 1–20 keV and 2.7–20 keV. (b) A power spectrum derived from the first half of the data in the energy range 1–20 keV. (c) A power spectrum derived from the second half of the data in the energy range 1–20 keV. (d) The window function for the whole term analysis.
Other Images in This Article
Copyright and Terms & Conditions
© 2000. The American Astronomical Society. All rights reserved. Printed in U.S.A.
Copyright ©
2025 Astronomy Image Explorer. All Rights Reserved.