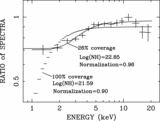
Image Details
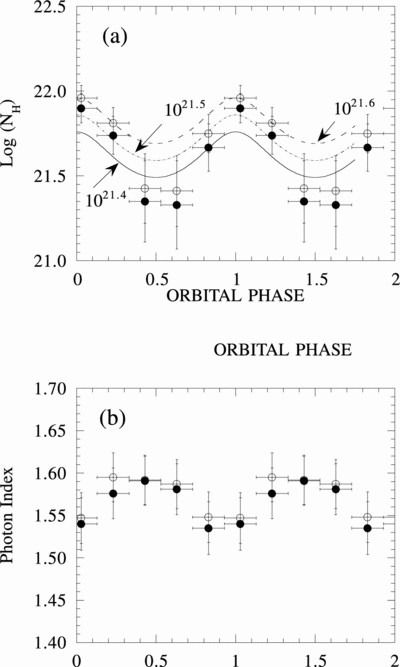
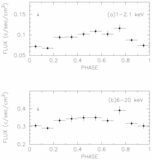
Caption: Fig. 5.
Best‐fit spectral parameters vs. 5.6 days orbital phase. The open circles are obtained from fittings using all channels and the closed circles are obtained omitting the 6–9 keV band. The errors are 90% confidence limits. (a) Fitted photoelectric absorption column density. The expected column densities according to a constant‐velocity stellar wind are also plotted. The numbers shown in the figures are ﹩\dot{M}_{w}/4\pi av_{w}﹩, where ﹩\dot{M}_{w}﹩ is the mass‐loss rate of the companion O star, a is the separation of the binary, and ﹩v_{w}﹩ is the wind velocity. (b) The best‐fit photon indices of the power‐law model.
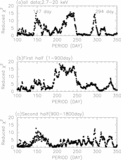
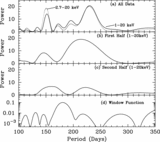
Other Images in This Article
Copyright and Terms & Conditions
© 2000. The American Astronomical Society. All rights reserved. Printed in U.S.A.