Image Details
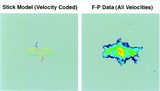
Caption: Fig. 4.
Four isosurfaces from the [N II] Fabry‐Perot data cube. Isosurface values rendered are 150, 2400, 5000, and 20,000 DN (see Fig. 3 legend) which are successively more opaque (darker). The cube is oriented so that velocity is the horizontal axis whose extent is 480 km s−1. The vertical axis corresponds to the northeast‐southwest direction on the sky (i.e., northeast is up); each arrow is ~45﹩\arcsec﹩. The plane of the sky is perpendicular to the plane of the figure with an observer viewing from the right. The observer sees the northeast jet approaching relative to a receding southwest jet. Note the intensity‐velocity structure of the strong northeast jet in contrast with the amorphous southwest jet. The observed jet velocities here are radial and, therefore, lower limits to the true space velocities which are geometry dependent (see text).
Other Images in This Article
Copyright and Terms & Conditions
© 1999. The American Astronomical Society. All rights reserved. Printed in U.S.A.