Image Details
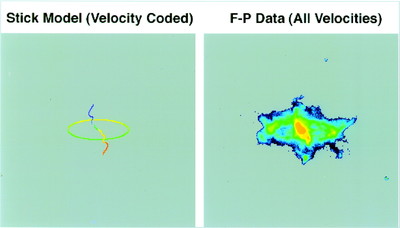
Caption: Fig. 1.
Side‐by‐side image of R Aqr in [N II] emission and our idealized model; north is up, and east is left. The right‐hand panel shows the [N II] emission spatial structure of R Aqr at all velocities obtained from integrating over the main part of the line in the Fabry‐Perot data cube and, as such, is representative of a what would be found on a deep narrowband [N II] image; in this panel emission intensity is log stretched and increases from blue (~0 dex) to red (~5.25 dex). The left‐hand panel shows the model which is velocity coded with extreme red (blue) corresponding to a radial velocity of +175 (−175) km s−1 (see Fig. 5 legend). Both the right and left panels are on the same spatial scale and the model's oval structure is ~120﹩\arcsec﹩ long.This figure is also intended to introduce the format of the movie (MPEG movie [~1.06 Mbytes]) showing spatial details as a function of velocity for both the [N II] Fabry‐Perot data and the model—specifically, a side‐by‐side comparison of the spatial structure of the data and the model (details in Fig. 5) as a function of the 41 velocity planes.
Other Images in This Article
Copyright and Terms & Conditions
© 1999. The American Astronomical Society. All rights reserved. Printed in U.S.A.