Image Details
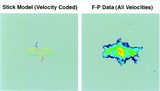
Caption: Fig. 3.
Two isosurfaces from the [N II] Fabry‐Perot data cube. The cube data numbers (DN) represent emission intensity (see text) and achieve a maximum of 24,232 DN. Isosurface values used here are rendered as a translucent 77 DN, which outlines the elliptical nebulosity making up the waist of the hourglass shell, and an opaque (darker) 150 DN, which shows the more intense regions of the elliptical nebulosity, the strong northeast jet, and the amorphous southwest jet. The transparent isosurface was chosen with a high enough signal‐to‐noise value to ensure that noise would not hinder discerning the morphology of the weaker elliptical nebulosity. The upper panel shows the data cube oriented with the celestial coordinate axes (α, δ) lying in the plane of the figure (northeast is up, and southeast is left) and the velocity coordinate axis implicitly perpendicular to the plane of the figure. This is the usual "radial velocity" orientation presented to an observer or an instrument, and note that no velocity information is possible in this view of the data cube. The central northeast‐southwest jet is vertically aligned, and the continuum emission from the LPV is not rendered, appearing as a circular hole in the data between the northeast and southwest jet components. The lower panel shows the data cube rotated to simultaneously view the velocity and spatial structure of both jet components; the pipelike structure is due to continuum emission from the LPV (i.e., emission at all velocities) and is hollow since it is not rendered (cf. Fig. 4).
Other Images in This Article
Copyright and Terms & Conditions
© 1999. The American Astronomical Society. All rights reserved. Printed in U.S.A.