

Image Details
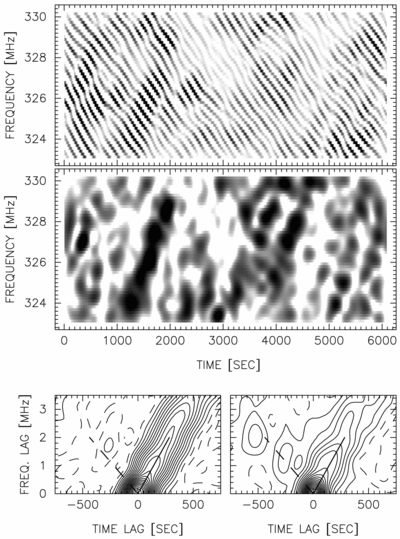
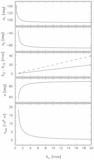
Caption: Fig. 2.
Dynamic spectrum for the second epoch (1994 April 30), after passing through the high pass filter (top panel) and the low pass filter (middle panel), as described in the text. The bottom panel shows the autocorrelation functions for the low pass filtered data, as described in the text. The solid and dashed lines represent the estimated drift slopes.
Other Images in This Article
Copyright and Terms & Conditions
© 1999. The American Astronomical Society. All rights reserved. Printed in U.S.A.

Copyright ©
2026 Astronomy Image Explorer. All Rights Reserved.
