

Image Details
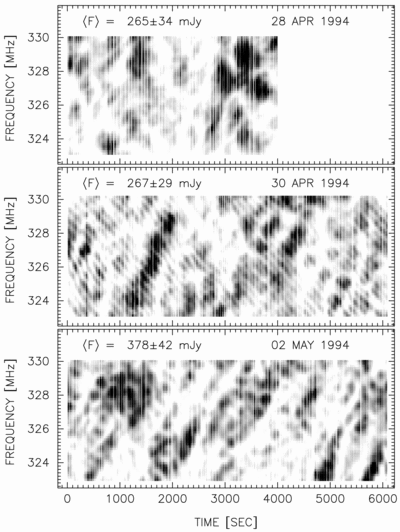
Caption: Fig. 1.
Dynamic scintillation spectra of PSR B1133+16 at 3 epochs. The intensity variations are represented in a linear gray scale, with darker regions corresponding to higher intensity values. The date of the observation is given at the top right of each panel, and the mean flux density at the top left of each panel.
Other Images in This Article
Copyright and Terms & Conditions
© 1999. The American Astronomical Society. All rights reserved. Printed in U.S.A.

Copyright ©
2026 Astronomy Image Explorer. All Rights Reserved.
