Image Details
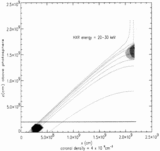
Caption: Fig. 4.
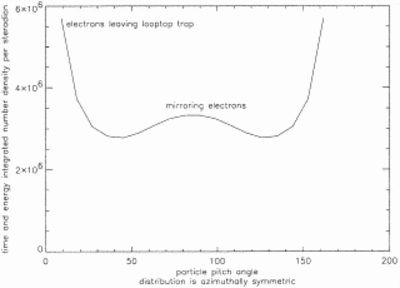
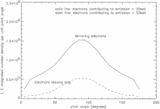
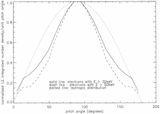
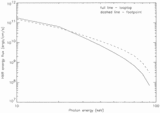
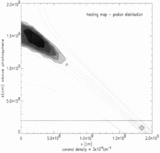
Solid‐angle distribution of all electrons in the looptop region, showing the almost isotropic mirroring component at pitch angles of ~90° and the beam distributions leaving the looptop in opposite directions. The particle number is the time‐integrated number of test particles recorded in the simulation, divided by sin θ, where θ is the pitch angle. Note that this figure includes all electrons, from 15 keV upward, unlike the distributions in Fig. 2 , which show only the higher energy parts of the total distribution.
Other Images in This Article
Copyright and Terms & Conditions
© 1998. The American Astronomical Society. All rights reserved. Printed in U.S.A.
Copyright ©
2025 Astronomy Image Explorer. All Rights Reserved.