Image Details
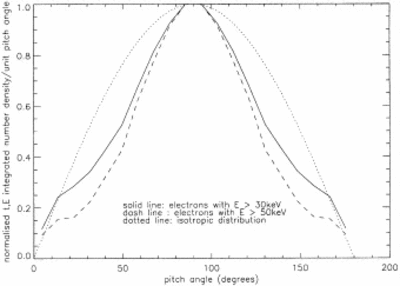
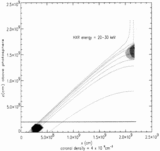
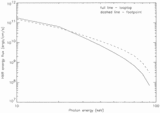
Caption: Fig. 3.
Pitch‐angle distribution of electrons in the looptop region, at energies >30 keV (solid line) and >50 keV (dashed line), normalized to the maximum number in each energy range. The dotted line is the isotropic [f(θ) = sin θ] distribution.
Other Images in This Article
Copyright and Terms & Conditions
© 1998. The American Astronomical Society. All rights reserved. Printed in U.S.A.
Copyright ©
2025 Astronomy Image Explorer. All Rights Reserved.