Image Details
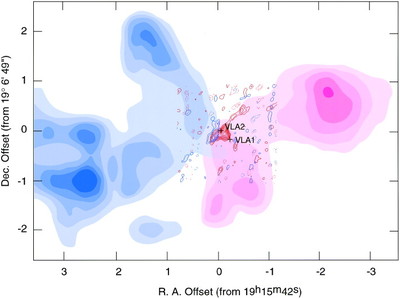
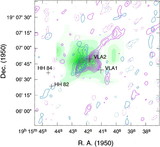
Caption: Fig. 5.
Comparison of the interferometric CO map (blue and red contours) and the single‐dish CO J = 1–0 map observed with the 45 m telescope by Hayashi et al. (1991; blue and red shaded). The contours of the interferometric map are drawn in the same manner as in Fig. 4. The velocity intervals of the single‐dish map are from −5 to 8 km s−1 for the blueshifted (blue shaded; lowest 3, step 1 K km s−1) and from 13 to 26 km s−1 for the redshifted (red shaded; lowest 2, step 1 K km s−1) components. Crosses denote the positions of VLA 1 and VLA 2.
Other Images in This Article
Copyright and Terms & Conditions
© 1998. The American Astronomical Society. All rights reserved. Printed in U.S.A.
Copyright ©
2025 Astronomy Image Explorer. All Rights Reserved.