Image Details
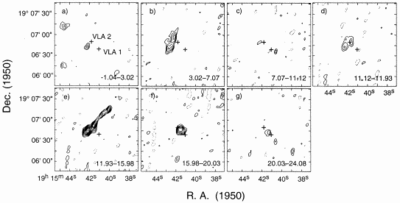
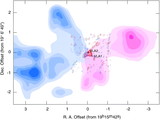
Caption: Fig. 3.
Channel‐velocity maps of the CO J = 1–0 emission taken with the NMA. (a–c) Maps of the blueshifted CO emission. Each map was obtained by integrating five channels corresponding to a velocity resolution of 4 km s−1. Contours are every 1.22 Jy km s−1 beam−1 (1.5 σ) with the lowest contours of 2.43 Jy km s−1 beam−1 (3 σ). The dotted contours are for negative intensity. Two crosses in each panel denote the positions of VLA 1 and VLA 2. (d) Map of the line‐center channel. Contours are every 0.61 Jy km s−1 beam−1 (1.5 σ), with the lowest contours of 1.22 Jy km s−1 beam−1 (3 σ). (e–g) Maps of the redshifted CO emission obtained by integrating five channels. Contours are drawn in the same manner as in (a), (b), and (c).
Other Images in This Article
Copyright and Terms & Conditions
© 1998. The American Astronomical Society. All rights reserved. Printed in U.S.A.