Image Details
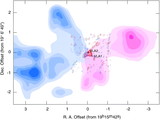
Caption: Fig. 2.
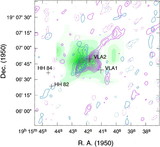
Channel‐velocity maps of the CS J = 3–2 emission with the velocity interval of 0.5 km s−1. Contours are every 0.1 K km s−1 (1.5 σ) with the lowest contours of 0.2 K km s−1 (3 σ). The positions of VLA 1 and VLA 2 are indicated with crosses.
Other Images in This Article
Copyright and Terms & Conditions
© 1998. The American Astronomical Society. All rights reserved. Printed in U.S.A.
Copyright ©
2025 Astronomy Image Explorer. All Rights Reserved.