Image Details
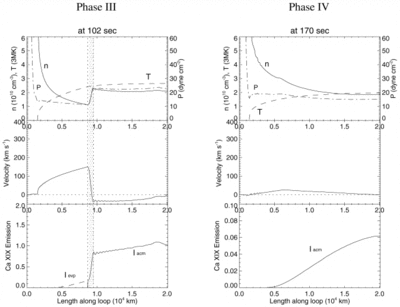
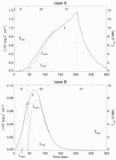
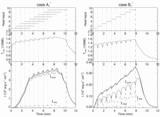
Caption: Fig. 5.
Same as Fig. 2 but for case B (τheat = 44 s < τc). Differences from case A appear after phase II. Note the various vertical scales of the line emission.
Other Images in This Article
Show More
Copyright and Terms & Conditions
© 1998. The American Astronomical Society. All rights reserved. Printed in U.S.A.
Copyright ©
2025 Astronomy Image Explorer. All Rights Reserved.