

Image Details
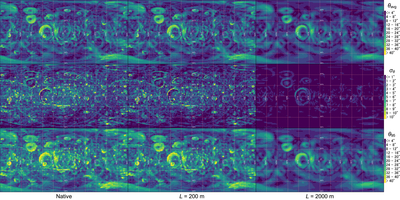
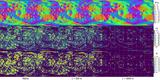
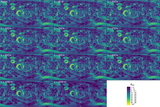
Caption: Figure 6.
Representative global maps of slope-magnitude statistics using the primary W = 2° spatial support. Area-weighted 2° × 2° maps are shown for the native unsmoothed reference (left), L = 200 m (middle), and L = 2000 m (right), corresponding to the native model, the upper end of the densely sampled low 100 m interval, and the coarsest tested scale. Facet assignment follows the fixed-support procedure in Section 2.1. Rows show ﹩{\theta }_{{\rm{avg}}}﹩ (top), ﹩{\sigma }_{\theta }﹩ (middle), and ﹩{\theta }_{95}﹩ (bottom). Within each row, all three columns share a single color scale, shown at right, so that differences between columns represent changes in the mapped quantity rather than changes in scaling; the nearly uniform appearance of the ﹩{\sigma }_{\theta }﹩ panel at L = 2000 m therefore indicates genuine suppression of within-cell slope dispersion. Colors are shown in discrete bins to reflect the cell-based 2° × 2° statistics.
Other Images in This Article

Copyright and Terms & Conditions
© 2026. The Author(s). Published by the American Astronomical Society.

