

Image Details
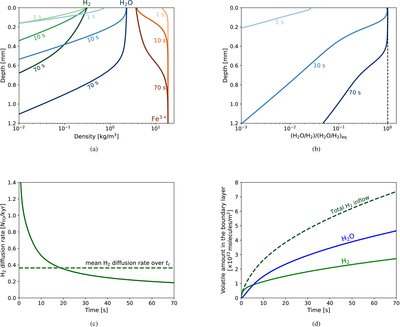
Caption: Figure 4.
(a) Density profiles of H2 (green), H2O (blue), and Fe3+ (orange) and (b) the H2O/H2 density ratio normalized by its equilibrium value at each depth in the boundary layer at selected times during a boundary layer overturn time of 70 s. The full boundary layer thickness calculated from Equation (34) is 19 mm, but only the upper part of the boundary layer, where H2 diffusion occurs, is shown for clarity. Color gradients indicate temporal evolution. The H2 surface pressure is 300 bar, the surface temperature is 2400 K, and the initial Fe3+/Fe2+ ratio is 0.08. The overturn time of 70 s corresponds to a surface temperature of 2400 K, a magma ocean bottom pressure of 50 GPa, and an internal heat flux of 400 W m−2, representative of the early stage of magma ocean evolution shown in Figures 6 and 7. (c) Corresponding temporal evolution of the H2 diffusion rate normalized by the hydrogen molecular number in the present-day terrestrial seawater (NTO). The dashed line represents the mean H2 diffusion rate over the overturn time, as defined by Equation (41). (d) Corresponding temporal evolution of the amounts of H2 (green) and H2O (blue) in the boundary layer. The dashed line represents the cumulative H2 inflow into the boundary layer.
Other Images in This Article
Copyright and Terms & Conditions
© 2026. The Author(s). Published by the American Astronomical Society.

