

Image Details
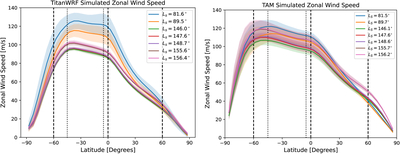
Caption: Figure 7.
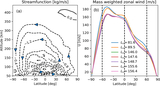
Model zonal wind velocity profiles (v(l)) for the approximate dates (Ls) observed by ALMA, extracted from (left) the TitanWRF GCM (Y. Lian et al. 2025) and (right) the TAM GCM (N. A. Lombardo & J. M. Lora 2023a). Wind speeds have been averaged over 10 model years and vertically weighted using the average CH3CN contribution function (Figure B2). Vertical dashed lines indicate l = −60°, 0°, and 60°; dotted lines indicate l = −45° and −5°. 1σ uncertainty envelopes indicate the standard deviation of the wind speeds over the (multiyear) modeled periods.
Other Images in This Article
Show More
Copyright and Terms & Conditions
© 2026. The Author(s). Published by the American Astronomical Society.

Copyright ©
2026 Astronomy Image Explorer. All Rights Reserved.
