

Image Details
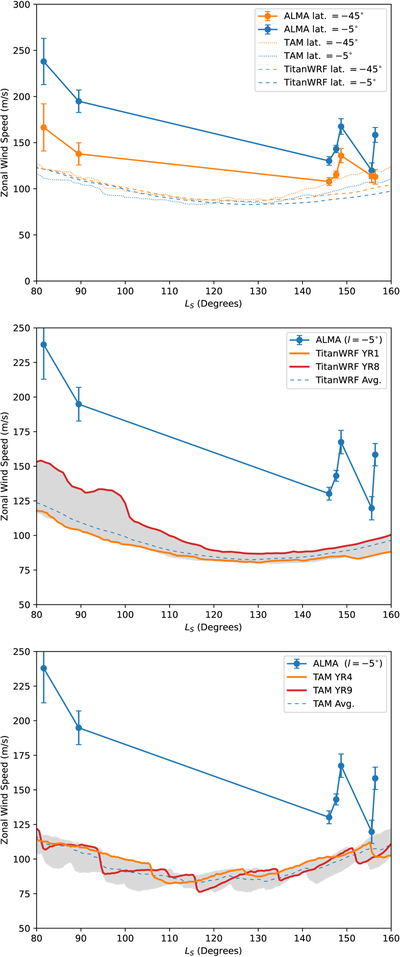
Caption: Figure 6.
Observed and theoretical zonal wind velocity profiles as a function of time (expressed in terms of Ls) for the period 2022 June 10 to 2023 May 9. Top panel: winds extracted at latitudes l = −5° and l = −45°, corresponding to the equatorial and high-latitude winds, respectively, compared with TitanWRF and TAM model data (averaged over 10 Saturnian years and vertically weighted using the mean CH3CN contribution function shown in Figure B2). Middle: observed zonal winds at l = −5° compared with vertically averaged TitanWRF output, where the gray envelope shows the range of model wind speeds across 10 model years, and the solid lines are for particular (arbitrarily chosen) model years. Bottom: same as middle, but using TAM GCM output. Wind speeds predicted by the GCMs are typically lower and less variable than those observed with ALMA, particularly in the vicinity of the equator.
Other Images in This Article
Show More
Copyright and Terms & Conditions
© 2026. The Author(s). Published by the American Astronomical Society.

