

Image Details
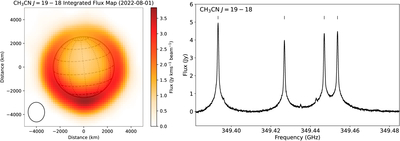
Caption: Figure 1.
Continuum-subtracted ALMA observations of Titan on 2022-08-01, showing the spectrally integrated line flux map for the CH3CN J = 19–18 band (left panel) and corresponding, disk-integrated spectrum (right panel), summed over a 1﹩\mathop{.}\limits^{{\unicode{x02033}}}﹩5-diameter (9700 km) circular aperture centered on Titan. The FWHM of the spatial resolution element (ellipse) is shown in the lower left of the map. The four strongest lines in the spectrum (marked with ticks) correspond to the (JK = 19K–18K; ∣K∣ = 0–3) transitions of CH3CN, while the weaker lines (at 349.396 GHz, 349.435 GHz and 349.442 GHz) originate from C2H5CN emission.
Other Images in This Article
Show More
Copyright and Terms & Conditions
© 2026. The Author(s). Published by the American Astronomical Society.

