

Image Details
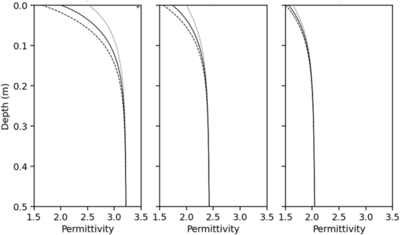
Caption: Figure 1.
Subsurface permittivity structure of anorthositic regolith, accounting for subsurface porosity and temperature. Left: equatorial region. Middle: 80°S latitude. Right: 89°S latitude. The solid line represents the daily mean permittivity, the dashed line corresponds to the permittivity at the minimum temperature, and the dotted line indicates the permittivity at the maximum temperature. With increasing latitude, the temperature variation decreases, resulting in smaller diurnal temperature-driven variations in permittivity at a given depth.
Other Images in This Article
Copyright and Terms & Conditions
© 2026. The Author(s). Published by the American Astronomical Society.

Copyright ©
2026 Astronomy Image Explorer. All Rights Reserved.
