

Image Details
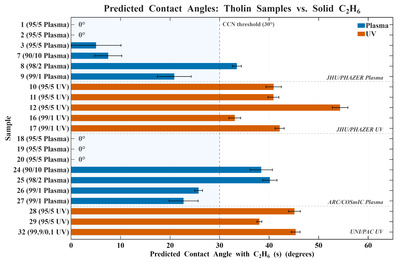
Caption: Figure 6.
Predicted contact angles between each pristine tholin sample and solid C2H6 condensate, grouped by experimental setup. Bars are color-coded by energy source: blue for plasma discharge (JHU/PHAZER and ARC/COSmIC) and orange for UV irradiation (JHU/PHAZER and UNI/PAC). Horizontal error bars represent 1σ uncertainties propagated from the measured surface energy components. The vertical dashed line at 30° marks the upper boundary of the contact angle range considered favorable for efficient CCN activity (J. E. McDonald 1964; P. C. Mahata & D. J. Alofs 1975; X. Yu et al. 2021; J. Li et al. 2022). The light blue shaded region (θ < 30°) highlights the CCN-favorable zone. Samples are grouped by experimental setup, with italic labels indicating the setup name at the bottom right of each group. Predicted contact angles with solid and liquid CH4 and liquid N2 are 0° for all samples; these complete-wetting cases are therefore not shown. For liquid C2H6, all plasma samples also yield θ = 0°; nonzero predicted angles are found only for three UV samples: 31﹩\mathop{.}\limits^{{\unicode{x000b0}}}﹩76 ± 2﹩\mathop{.}\limits^{{\unicode{x000b0}}}﹩85 (sample 12, JHU/PHAZER UV), 6﹩\mathop{.}\limits^{{\unicode{x000b0}}}﹩38 ± 6﹩\mathop{.}\limits^{{\unicode{x000b0}}}﹩38 (sample 28, UNI/PAC UV), and 6﹩\mathop{.}\limits^{{\unicode{x000b0}}}﹩29 ± 6﹩\mathop{.}\limits^{{\unicode{x000b0}}}﹩29 (sample 32, UNI/PAC UV).
Other Images in This Article
Copyright and Terms & Conditions
© 2026. The Author(s). Published by the American Astronomical Society.

