

Image Details
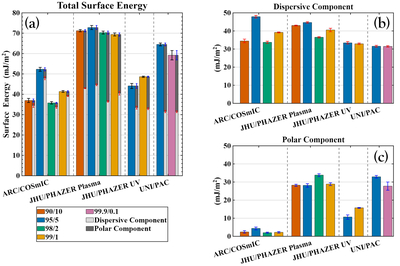
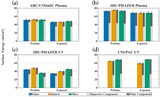
Caption: Figure 5.
Surface energies of pristine tholins for each gas mixture and experimental setup. Panel (a) shows total surface energy with dispersive (silver) and polar (gray) components; panels (b) and (c) emphasize the dispersive and polar components, respectively. Bar colors denote the initial N2/CH4 gas mixture. Black, red, and blue error bars denote 1σ uncertainties in the total, dispersive, and polar values, respectively.
Other Images in This Article
Copyright and Terms & Conditions
© 2026. The Author(s). Published by the American Astronomical Society.

Copyright ©
2026 Astronomy Image Explorer. All Rights Reserved.
