

Image Details
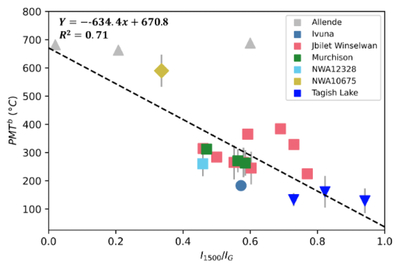
Caption: Figure 16.
PMTs calculated using the method of G. Cody et al. (2008) plotted as a function of the I1500/IG ratio. Error bars are the standard deviations for the calculated PMTs for that map.
Other Images in This Article
Show More
Copyright and Terms & Conditions
© 2026. The Author(s). Published by the American Astronomical Society.

Copyright ©
2026 Astronomy Image Explorer. All Rights Reserved.
