

Image Details
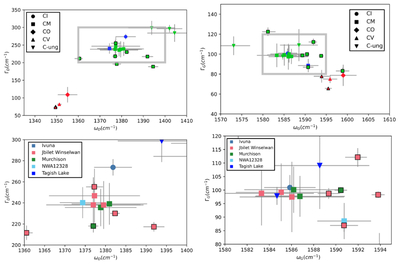
Caption: Figure 14.
Left: ΓD plotted as a function of ωD, with the full parameter space on top and the boxed-in region zoomed in on the bottom. Right: ΓG plotted as a function of ωG, with the full parameter space on top and the boxed-in region zoomed in on the bottom. In the top images, the marker color indicates the petrologic type of the sample: type 1 (blue), type 2 (green), or type 3 (red). In the bottom images, the marker color indicates the specific meteorite. Markers without borders are the mean values of the maps, and their error bars represent the 1σ standard deviations. Markers with a black border are the values obtained for the single-spot spectra, and their error bars represent the 1σ confidence bounds.
Other Images in This Article
Show More
Copyright and Terms & Conditions
© 2026. The Author(s). Published by the American Astronomical Society.

