

Image Details
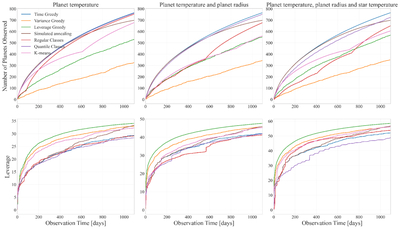
Caption: Figure 11.
Comparison of cumulative curves for each of the seven selection strategies discussed in the paper. The top row shows the number of planets selected as a function of observation time in days. The bottom row similarly shows the sample leverage as a function of observation time. The left (middle, right) columns represent the results for the one- (two-, three-) parameter exercise, respectively.
Other Images in This Article
Copyright and Terms & Conditions
© 2026. The Author(s). Published by the American Astronomical Society.

Copyright ©
2026 Astronomy Image Explorer. All Rights Reserved.
