

Image Details
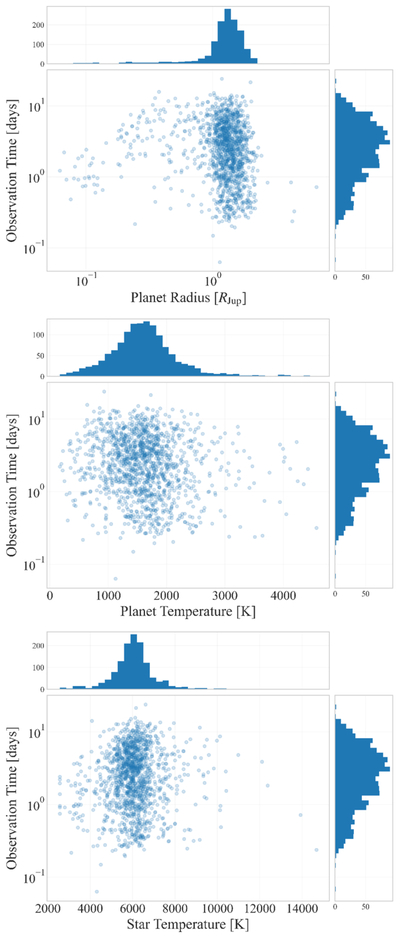
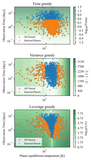
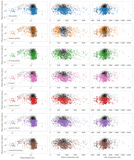
Caption: Figure 1.
Scatter plots of the total observation time per planet required to reach an Ariel Tier 2 transit SNR versus the planet radius (top panel), the planet temperature (middle panel), and the star temperature (bottom panel). The histograms are projections onto the corresponding marginal distributions.
Other Images in This Article
Copyright and Terms & Conditions
© 2026. The Author(s). Published by the American Astronomical Society.

Copyright ©
2026 Astronomy Image Explorer. All Rights Reserved.
