

Image Details
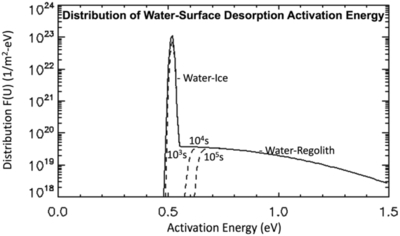
Caption: Figure 3.
The distribution of water desorption activation energy, F(U, t) for a surface consisting of ice (with a peak near 0.516 eV for water-ice desorption), with the last layer consisting of water–regolith desorption represented by the broader half-Gaussian between 0.5 and 1.5 eV. The dashed lines show the evolution of F(U, t) at three different times.
Other Images in This Article
Show More
Copyright and Terms & Conditions
© 2026. The Author(s). Published by the American Astronomical Society.

Copyright ©
2026 Astronomy Image Explorer. All Rights Reserved.
