

Image Details
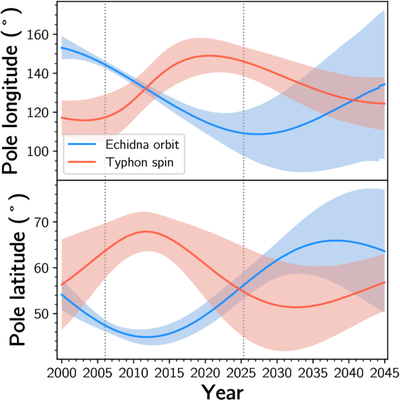
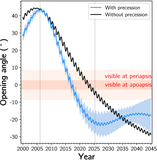
Caption: Figure 3.
Precession of Typhon’s spin pole and Echidna’s orbit pole. Colored lines and shaded regions indicate the mean and standard deviation of the orbit and spin pole direction of a sample of 500 posterior draws. Vertical dotted lines show the times of the first and last of our observations. Coordinates are referenced to the J2000 ecliptic reference frame. Since we assume all angular momentum in the system is contained within these two sources, any single self-consistent sample of parameters would produce perfectly sinusoidal variations. The angular separation between the red and blue curves is equal to the ﹩23.^\circ {8}_{-4.^\circ 6}^{+5.^\circ 1}﹩ misalignment between Typhon’s spin and Echidna’s orbit.
Other Images in This Article
Copyright and Terms & Conditions
© 2026. The Author(s). Published by the American Astronomical Society.

