

Image Details
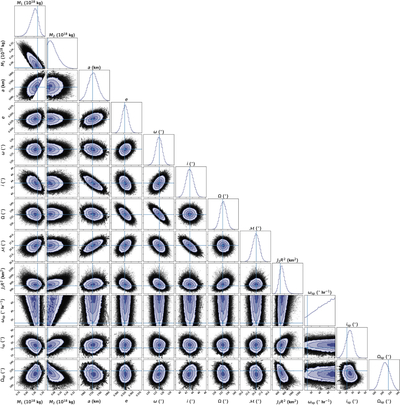
Caption: Figure 1.
A corner plot showing the posterior distribution from our non-Keplerian orbit fit. At the top of each column, marginal (one-dimensional) posterior distributions for each parameter are shown. Beneath, two-dimensional joint posterior distributions are shown for every pair of parameters. Contours on the joint distributions show the 0.5σ, 1σ, 1.5σ, and 2σ confidence intervals. Horizontal and vertical lines show the location of the best-fit parameter set.
Other Images in This Article
Copyright and Terms & Conditions
© 2026. The Author(s). Published by the American Astronomical Society.

Copyright ©
2026 Astronomy Image Explorer. All Rights Reserved.
