

Image Details
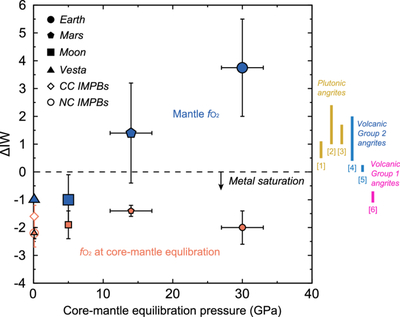
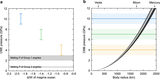
Caption: Figure 1.
fO2 during core formation and in present-day mantles of rocky bodies. fO2 is shown as the log-unit difference relative to the IW buffer. Blue and orange symbols represent present-day mantle fO2 values and fO2 during magma-ocean stages associated with core–mantle equilibration, respectively. Core–mantle equilibration pressures and magma-ocean fO2 data are from E. S. Steenstra et al. (2016, 2017), D. S. Grewal et al. (2022a, 2024), M. M. Hirschmann (2022), N. Rai & W. van Westrenen (2014), K. Righter & N. L. Chabot (2011), and K. Righter (2011). Present-day mantle fO2 data are from D. J. Frost et al. (2008) and references therein, R. W. Nicklas et al. (2021), and H. Zhang et al. (2024b). Yellow, blue, and pink vertical bars indicate estimated fO2 ranges for plutonic angrites [1] NWA 2999, [2] NWA 4590, and [3] NWA 4801 (M. E. Sanborn & M. Wadhwa 2021), volcanic Group 2 angrites [4] D’Orbigny (F. L. H. Tissot et al. 2022) and [5] D’Orbigny, Sahara 99555, and NWA 12004 (A. S. Bell et al. 2023a), and volcanic Group 1 angrite [6] NWA 12774 (A. S. Bell et al. 2023b).
Other Images in This Article
Copyright and Terms & Conditions
© 2026. The Author(s). Published by the American Astronomical Society.

