

Image Details
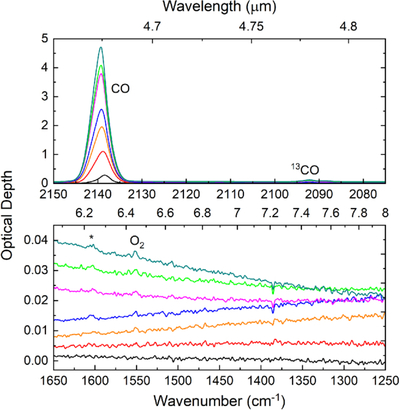
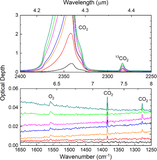
Caption: Figure 5.
IR spectra of a 1:1 O2: CO mixture during growth. Spectra have been vertically offset for clarity and (from bottom to top in each panel) correspond to a total thickness of ∼70, 444, 818, 1065, 1564, 1689, and 1939 nm. A trace amount of water contamination is marked by an *.
Other Images in This Article
Copyright and Terms & Conditions
© 2026. The Author(s). Published by the American Astronomical Society.

Copyright ©
2026 Astronomy Image Explorer. All Rights Reserved.
