

Image Details
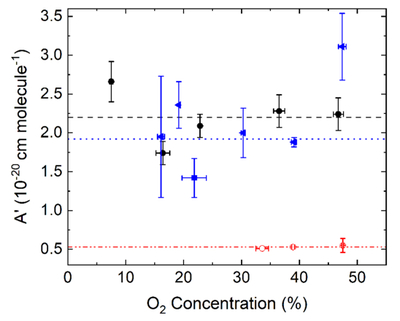
Caption: Figure 8.
A’-value of O2 in O2: H2O (black circles), O2: CO2 (blue triangles), and O2: CO (red open circles) mixtures versus O2 concentration. The dashed line is the mean for all of the H2O experiments, the dotted line is the mean for all of the CO2 experiments, excluding 1:1 concentrations, and the dashed–dotted line is the mean for all of the CO experiments.
Other Images in This Article
Copyright and Terms & Conditions
© 2026. The Author(s). Published by the American Astronomical Society.

Copyright ©
2026 Astronomy Image Explorer. All Rights Reserved.
