

Image Details
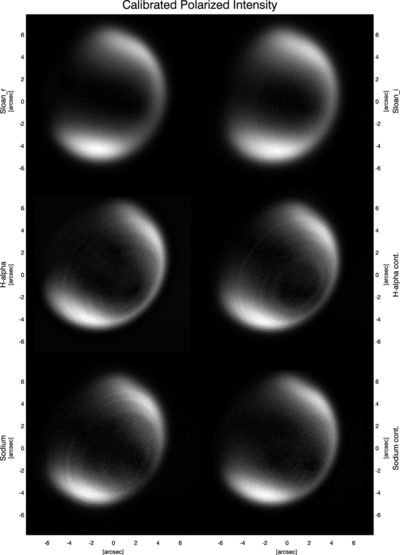
Caption: Figure 3.
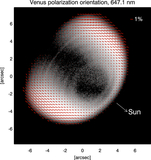
The polarized flux (﹩\sqrt{{Q}^{2}+{U}^{2}}﹩) as measured through the six filters (see Table 1). Top row: the Sloan r and Sloan i broadband filters. Middle row: the Hα and Hα continuum filters. Bottom row: the Na (sodium) and Na continuum filters. The time sequence of the observations is from top left to bottom right: 5–6–1–2–3–4. The ringlike pattern is apparent in the first three observations in chronological order (1, 2, 3) and not obvious in the last three (4, 5, 6). Notably, the Na image at 589.4 nm still shows a clear ring pattern despite having been obtained at higher air mass than the Hα and Hα continuum observations.
Other Images in This Article
Copyright and Terms & Conditions
© 2026. The Author(s). Published by the American Astronomical Society.

