Image Details
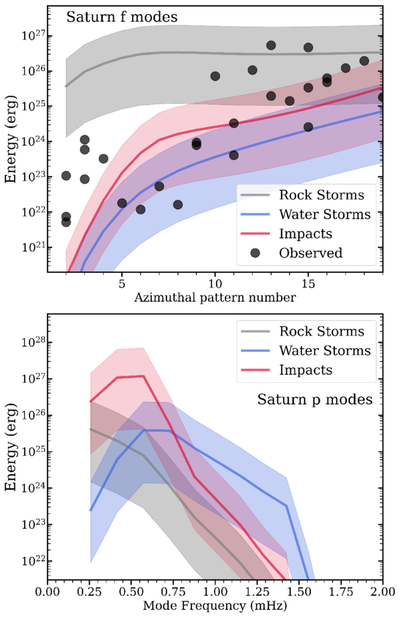
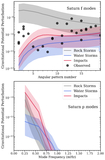
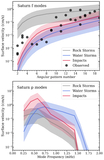
Caption: Figure 8.
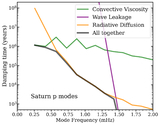
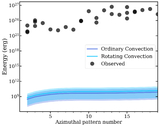
Top: energies of Saturn’s ℓ ∼ m f-modes as a function of the angular wavenumber ℓ. Black dots are observed modes from V. M. Afigbo et al. (2025), the gray region is the predicted energy range due to stochastic excitation by rock storms, the blue region is the predicted energy range from water storms, and the red region is the energy range due to cometary impacts. Mode damping times are taken from Figures 3 and 4. Bottom: same as the top panel, but now for Saturn’s ℓ = 2 p-modes as a function of the mode angular frequency ω.
Other Images in This Article
Show More
Copyright and Terms & Conditions
© 2026. The Author(s). Published by the American Astronomical Society.
Copyright ©
2026 Astronomy Image Explorer. All Rights Reserved.