Image Details
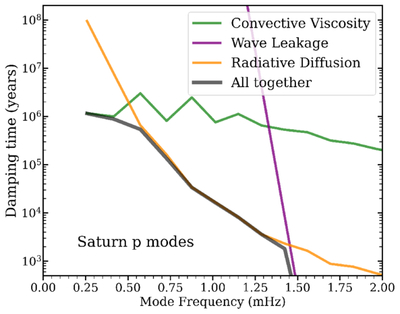
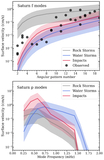
Caption: Figure 4.
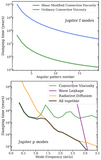
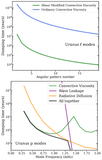
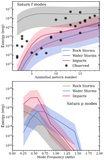
The damping time of ℓ = 2 p-modes of Saturn, as a function of mode frequency. The green line shows damping due to convective viscosity (Equation (14)), the orange line accounts for damping due to radiative diffusion, and the purple line accounts for wave damping above the acoustic cutoff frequency (Equation (16)). Modes with frequencies larger than f ≳ fac ∼ 1.5 mHz are strongly damped due to the latter effect.
Other Images in This Article
Show More
Copyright and Terms & Conditions
© 2026. The Author(s). Published by the American Astronomical Society.
Copyright ©
2026 Astronomy Image Explorer. All Rights Reserved.