Image Details
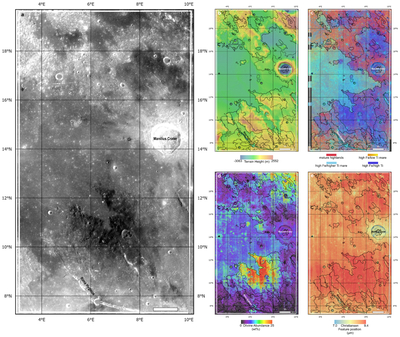
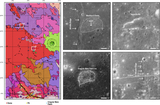
Caption: Figure 1.
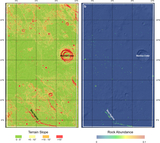
Our new geologic map is based on several combined datasets (see Section 2.1), including (a) Kaguya TC ortho images (J. Haruyama et al. 2008), (b) Kaguya TC DEMs (J. Haruyama et al. 2008), (c) and the Clementine UVVIS color ratio map (M. Lemelin et al. 2019), where the band ratios were 750 nm/415 nm (red), 750 nm/950 nm (green), and 415 nm/750 nm (blue). An olivine map (d) (P. G. Lucey et al. 2000), and the Christiansen feature map (e) (B. T. Greenhagen et al. 2010) were also used.
Other Images in This Article
Copyright and Terms & Conditions
© 2026. The Author(s). Published by the American Astronomical Society.
Copyright ©
2026 Astronomy Image Explorer. All Rights Reserved.