Image Details
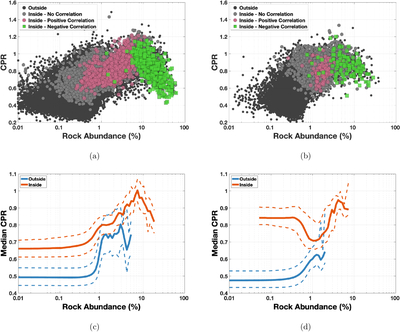
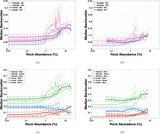
Caption: Figure 6.
CPR as a function of RA on a log-scaled axis for (left) Giordano Bruno and (right) Eimmart A. The top row shows the individual values for (dark gray) a random selection of values outside of three crater radii from the respective crater, and values inside three crater radii with (light gray) −0.6 < ρ < 0.6, (pink) ρ ≥ 0.6, and (green) ρ ≤ −0.6 (i.e., following the color bar in Figures 5(c) and (f)). The bottom row shows the median CPR behavior with RA over 50∘ ≤ θ ≤ 60∘ for (blue) outside of three crater radii of the studied crater, and (orange) inside of three crater radii. The median behavior (solid lines) is shown along with the interquartile range (dashed lines).
Other Images in This Article
Copyright and Terms & Conditions
© 2026. The Author(s). Published by the American Astronomical Society.