Image Details
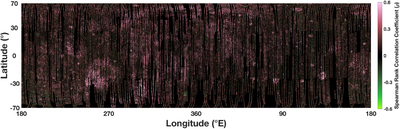
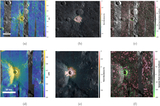
Caption: Figure 4.
Map of the Spearman rank correlation coefficient, ρ, for CPR and RA within a 6 × 6 pixel kernel. The map is limited within ±70∘, following Diviner-inferred RA limitations, and shown in a cylindrical equal area projection. Variation in ρ is illustrated in color following the color bar within −0.6 ≤ ρ ≤ 0.6 to highlight areas of significant, either negative or positive, correlations between CPR and RA.
Other Images in This Article
Copyright and Terms & Conditions
© 2026. The Author(s). Published by the American Astronomical Society.
Copyright ©
2026 Astronomy Image Explorer. All Rights Reserved.