Image Details
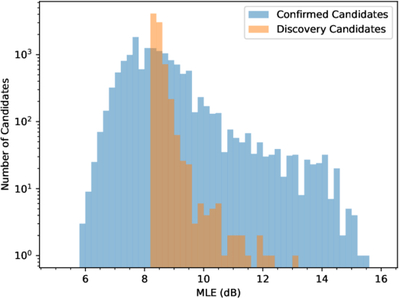
Caption: Figure 8.
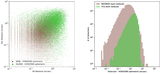
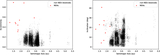
Histogram of MLE (dB) for all candidates submitted to the MPC, excluding identified false positives, with confirmed candidates shown in blue and discovery candidates shown in orange.
Other Images in This Article
Show More
Copyright and Terms & Conditions
© 2026. The Author(s). Published by the American Astronomical Society.
Copyright ©
2026 Astronomy Image Explorer. All Rights Reserved.