Image Details
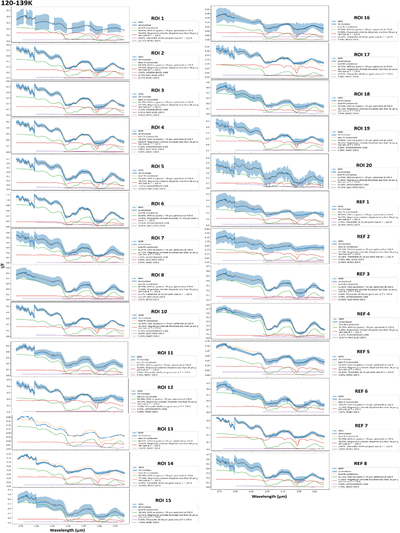
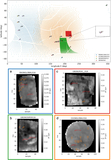
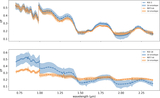
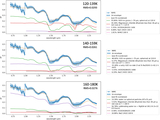
Caption: Figure A1.
Shows plots of the best-fit spectral models (step 6) for all ROIs (including the reference regions) across the three temperature ranges. Each panel shows the NIMS reflectance spectrum (blue points), 2σ uncertainty envelope (shaded), and the combined best-fit model (orange dashed line). The corresponding end-member contributions are indicated in the legend.
Other Images in This Article
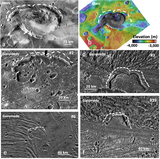
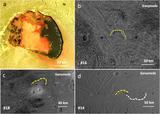
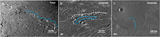
Show More
Copyright and Terms & Conditions
© 2026 The Author(s). Published by the American Astronomical Society.
Copyright ©
2026 Astronomy Image Explorer. All Rights Reserved.