Image Details
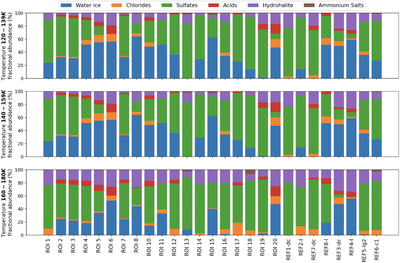
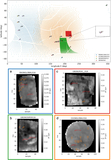
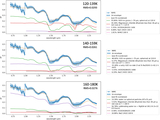
Caption: Figure 12.
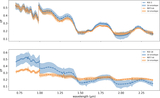
Fractional abundance (percentage) of major modeled surface components for all ROIs and reference regions, grouped by temperature interval: (a) 120–139 K, (b) 140–159 K, and (c) 160–180 K. Water ice (blue) dominates most spectra, with variable proportions of sulfates (green), chlorides (orange), hydrohalite (purple), and minor acid and ammonium salts. Systematic differences in the best-fit compositional mixtures are observed across the three panels, with higher-temperature laboratory end-member sets favoring increased contributions from sulfate- and hydrohalite-rich components relative to chlorides. These variations reflect the sensitivity of the spectral unmixing results to the selected temperature-dependent laboratory spectra rather than physical compositional changes on Ganymede. The comparison between ROIs and their corresponding reference regions highlights localized spectral differences relative to background terrains.
Other Images in This Article
Show More
Copyright and Terms & Conditions
© 2026 The Author(s). Published by the American Astronomical Society.