Image Details
Caption: Figure 6.
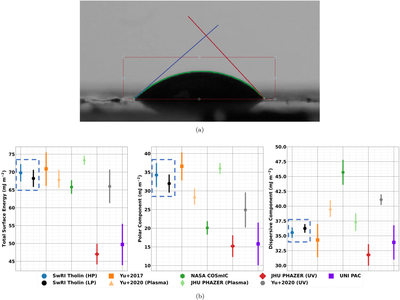
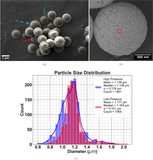
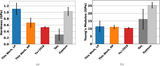
(a) Example of a one frame of a sessile droplet of diiodomethane and the contact angle it makes with a tholin film, as analyzed by the Ossila Contact Angle Software 4.0. The red bounding box indicates the droplet area analyzed, with the area outside of this bounding box not considered for the contact angle determination. The green curve indicates the outline of the analyzed droplet, and the black fill under the green curve indicates the detected droplet. The blue line indicates the left contact angle, while the red line indicates the right contact angle. These angles are measured from the bottom of the bounding box to the respective left/right line. (b) Summary of the total surface energy (left), polar component of the surface energy (middle), and dispersive component of the surface energy (right) of tholin samples. The red bounding box denotes the data obtained for this study. Total surface energy is given by summing the polar and dispersive components received from applying the OWRK method. Error bars for the samples used in this work are 1σ errors. Also included for comparison are surface energy results from the 5%/95% CH4/N2 gas mixture tholins from J. Li et al. (2022), for the PHAZER (C. He et al. 2017, ∼2 Torr), NASA THS (E. Sciamma-O’Brien et al. 2014, ∼22 Torr), and PAC (J. A. Sebree et al. 2018; ∼500 Torr) experimental setups.
Other Images in This Article
Copyright and Terms & Conditions
© 2026. The Author(s). Published by the American Astronomical Society.