Image Details
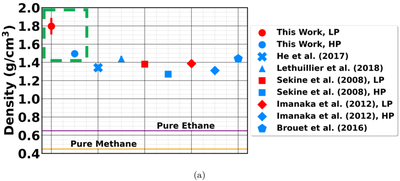
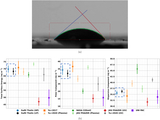
Caption: Figure 5.
Summary of helium pycnometry density data for tholin samples created using the 95% N2/5% CH4 initial gas mixture. The green bounding box indicates data obtained for this study. Previously published pycnometry data for tholin samples produced with the same gas mixture are provided for comparison (Y. Sekine et al. 2008; H. Imanaka et al. 2012; Y. Brouet et al. 2016; C. He et al. 2017; A. Lethuillier et al. 2018). Red points indicate LP samples and blue points indicate HP samples. The purple line indicates the density of pure liquid ethane between 90 and 95 K (ρ = 0.646−0.652 g·cm−3). The orange line indicates the density of pure liquid methane between 90 and 95 K (ρ = 0.445−0.452 g·cm−3). Pure liquid methane and ethane densities were calculated using Tables 2 and 8 from X. Yu et al. (2023).
Other Images in This Article
Copyright and Terms & Conditions
© 2026. The Author(s). Published by the American Astronomical Society.